Air Quality Index Visualization
Tuan Nhon Dang
1. Description:
The Air Quality Index (AQI) is a standardized indicator of the air quality in a given location. It uses the measure of particulates and contaminatants in the air to determine how clean the air is.
The United States Environmental Protection Agency (EPA) uses the following AQI structure and health classification:
Health classifications used by the EPA:
-
0-50 Good is usually green
-
51-100 Moderate is usually yellow
-
101-150 Unhealthy for sensitive groups is usually orange
-
151-200 Unhealthy is usually red
-
201-300 Very unhealthy is usually purple
-
301-500 Hazardous is usually maroon
2. Data:
Air Data source : http://www.epa.gov/air/airtrends/aqi_info.html
Number of Days with Air Quality Index Values Greater than 100 at 5 States, 1999-2007, Ozone Only
Metropolitan Statistical Area |
1999 | 2000 | 2001 | 2002 | 2003 | 2004 | 2005 | 2006 | 2007 |
| New York,NY | 26 | 34 | 25 | 34 | 14 | 10 | 19 | 14 | 18 |
| Chicago,IL | 22 | 6 | 22 | 32 | 13 | 5 | 23 | 7 | 17 |
| Dallas,TX | 33 | 44 | 32 | 17 | 13 | 15 | 33 | 28 | 11 |
| Albuquerque,NM | 5 | 7 | 1 | 7 | 15 | 3 | 9 | 3 | 1 |
| San Francisco,CA | 1 | 0 | 0 | 0 | 2 | 0 | 0 | 0 | 0 |
Number of Days with Air Quality Index Values Greater than 100 at 5 States, 1999-2007, PM2.5 Only
| Metropolitan Statistical Area | 1999 | 2000 | 2001 | 2002 | 2003 | 2004 | 2005 | 2006 | 2007 |
| New York,NY | 1 | 10 | 11 | 10 | 6 | 5 | 6 | 4 | 4 |
| Chicago,IL | 6 | 12 | 19 | 7 | 6 | 8 | 10 | 2 | 6 |
| Dallas,TX | 0 | 0 | 0 | 0 | 0 | 0 | 0 | 0 | 0 |
| Albuquerque,NM | 0 | 0 | 0 | 0 | 0 | 2 | 0 | 0 | 0 |
| San Francisco,CA | 0 | 0 | 0 | 3 | 0 | 0 | 0 | 0 | 0 |
3. Why is it a good visualization:
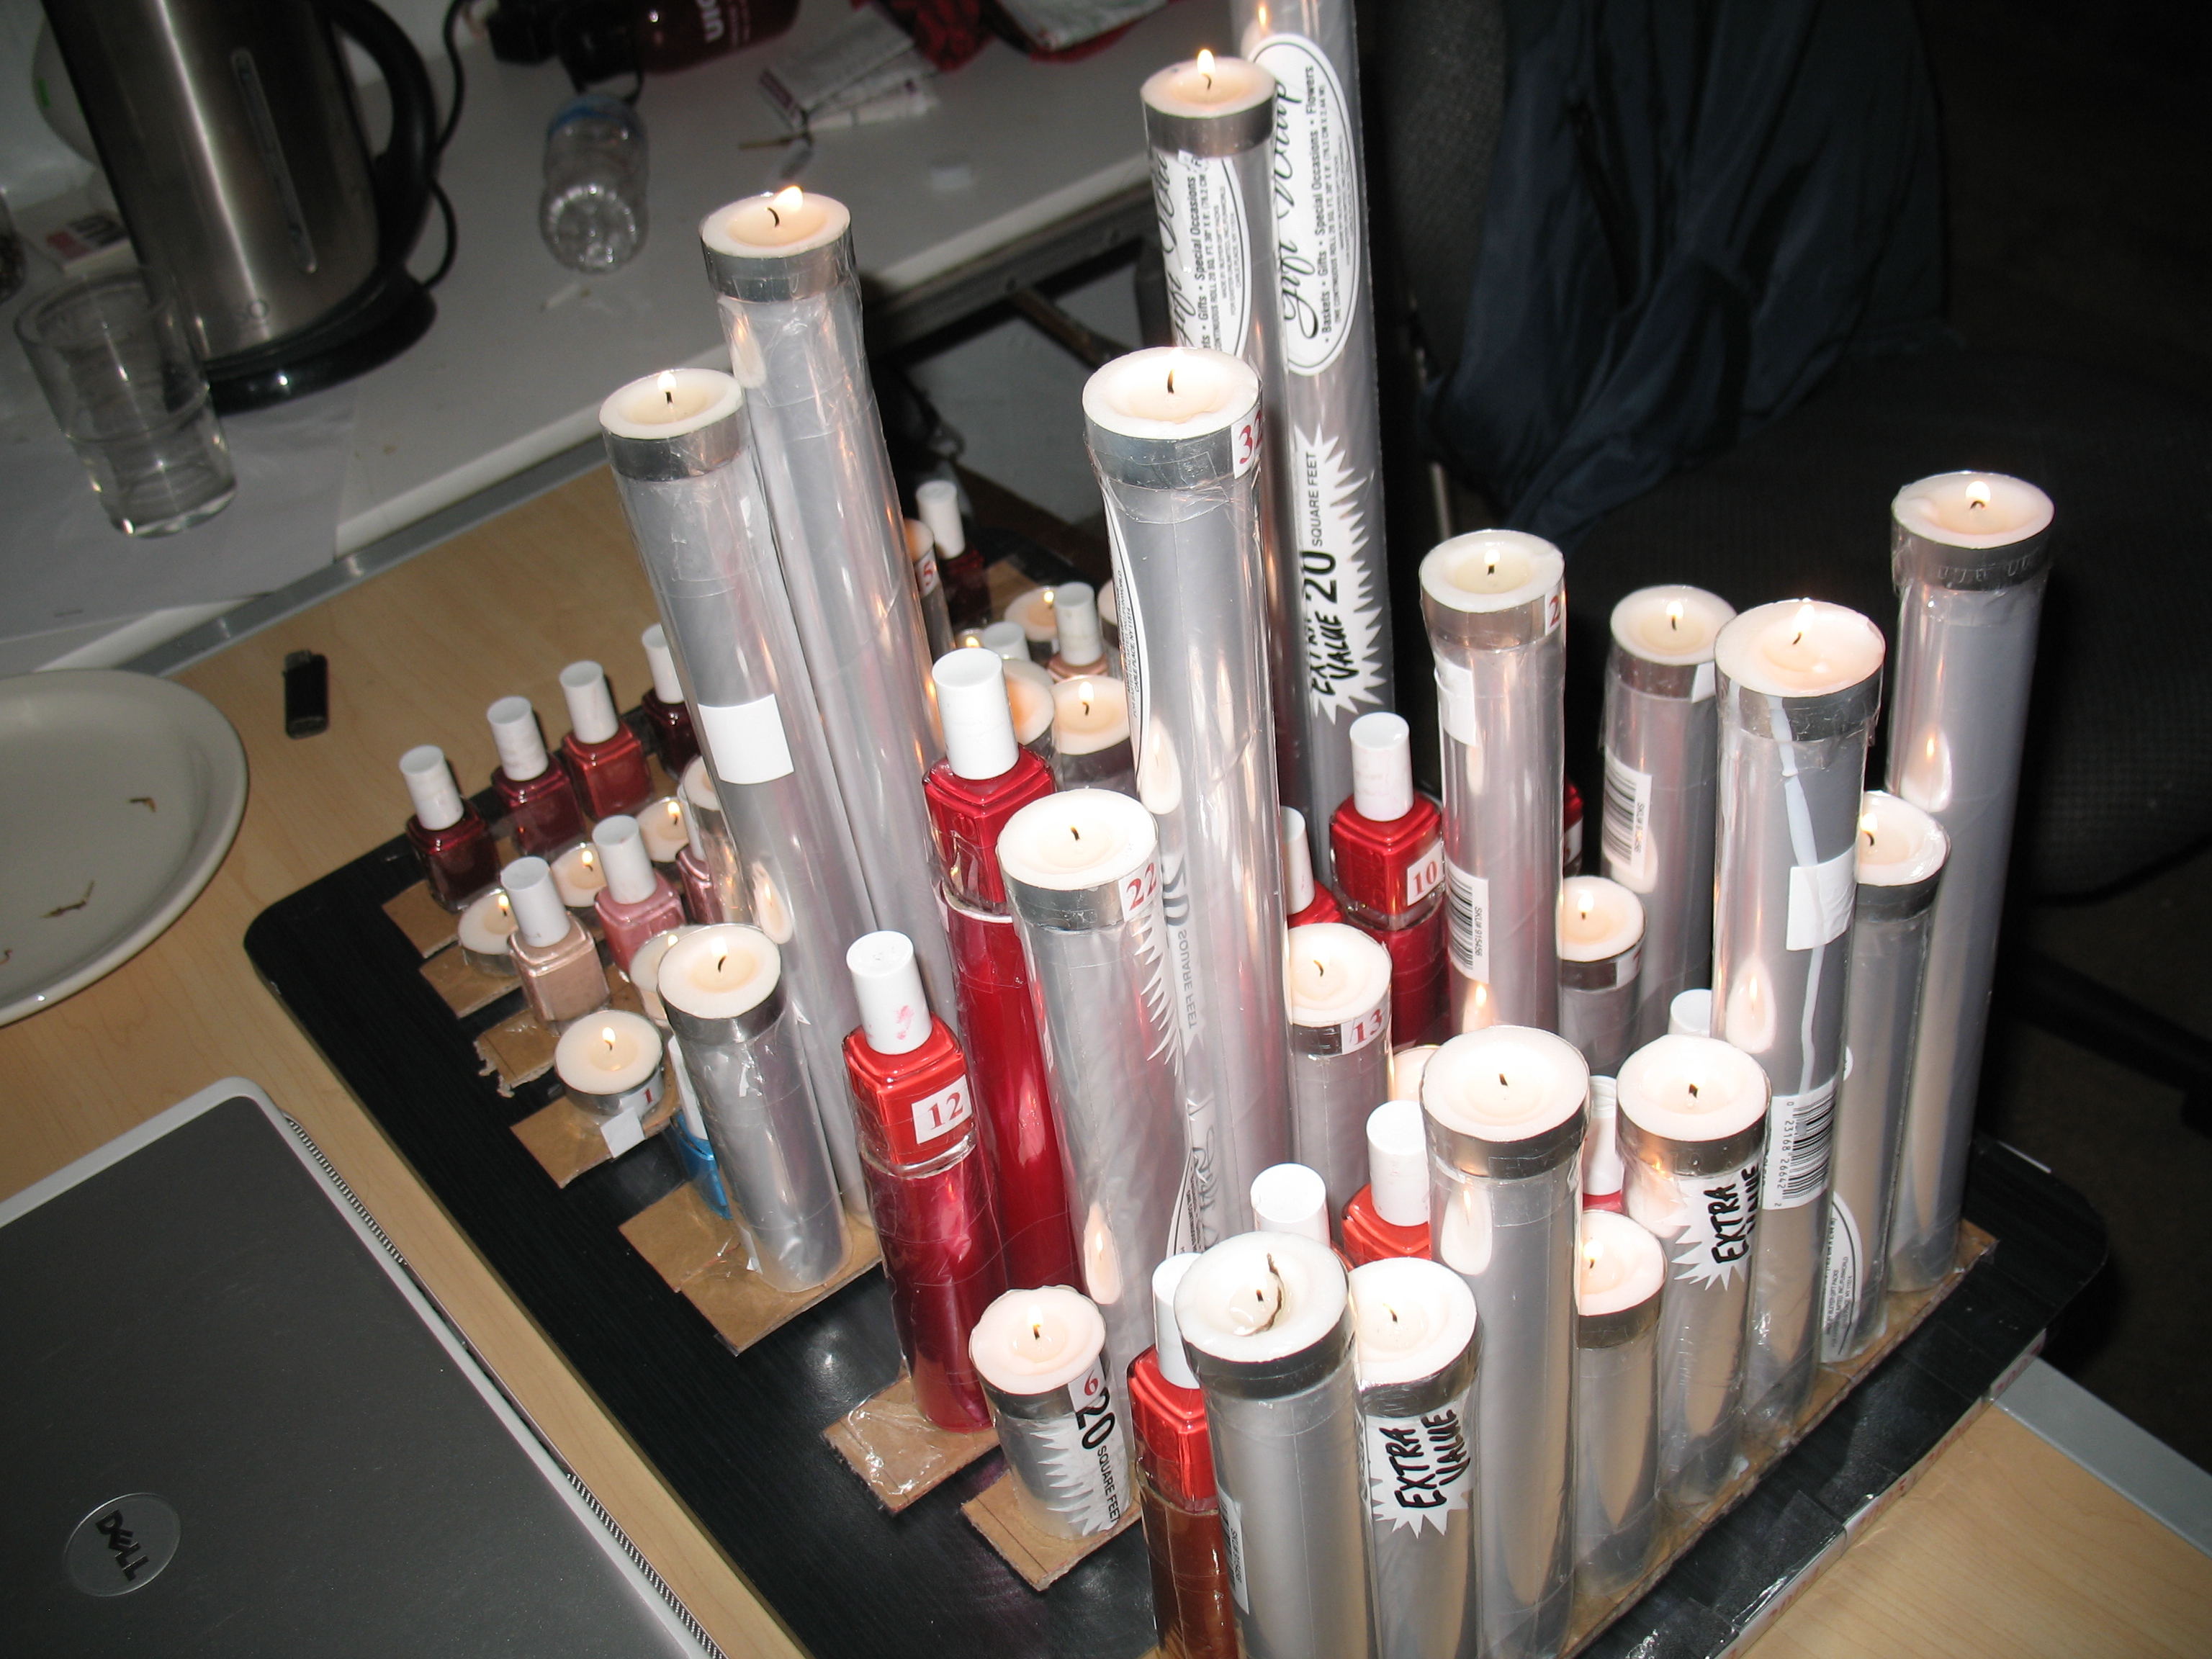
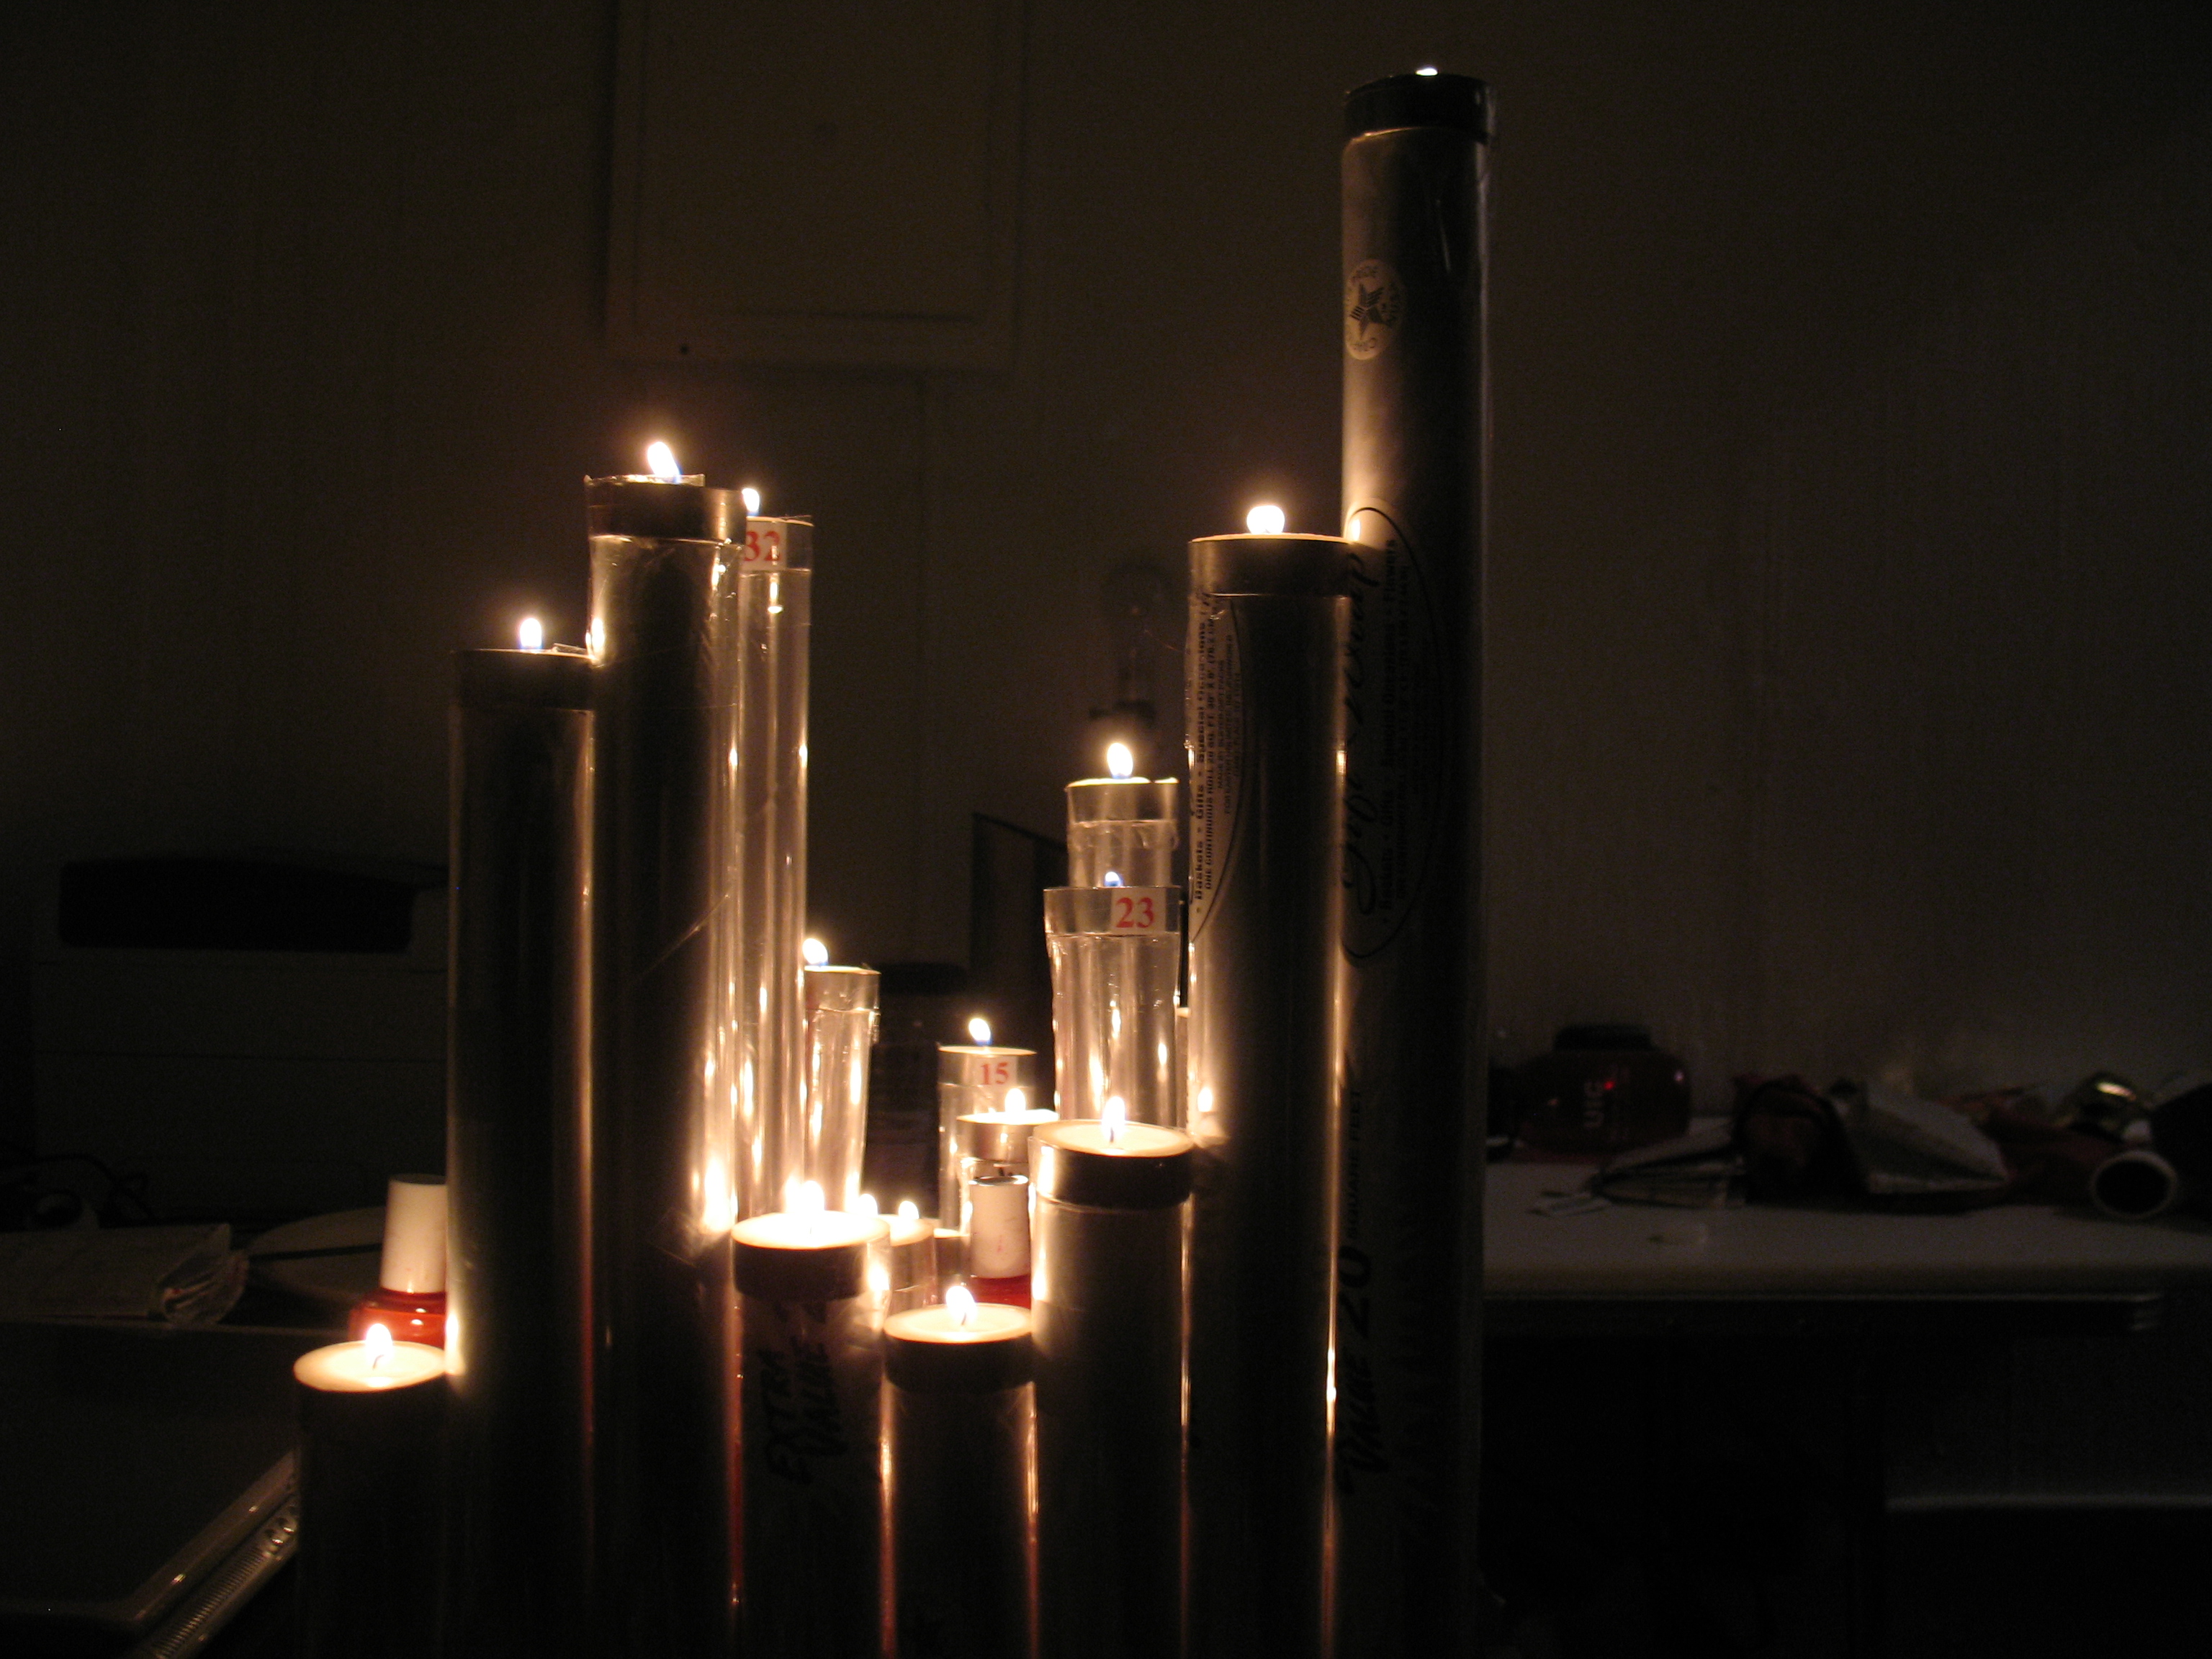
1. Simple model, based on the idea of 3-D chart. In this model, we can compare the CO pollution levelin different states of US, we can compare the PM2.5 pollution levelin different states of US, we can compare the CO vs PM2.5 pollution level in a single state or 5 states of US.
2. Reconfigurable. Because the base of this model is not fixed, We can move data around to the best view.
3. Explain the source of pollutions:
+ Candle is presented for incompleted burn, which forms CO
+ Polish liquid is presented for a complex mixture of extremely small particles and liquid droplets, which forms PM2.5
4. Visualization: